
The condensate recovery rate of a boiler is the percentage of condensate returned to the boiler from the steam system after it has transferred heat and undergone phase change.
Improving boiler efficiency by increasing condensate is a must and should be encouraged to achieve commercial targets of industries.
Content
- Why recovering the condensate is important in industries?
- Benefits of High Condensate Recovery Rate
- Example calculations to improve condensate recovery rate by using US DOE MEASUR TOOL
- How much makeup water can be saved by increasing the condensate recovery rate?
- Compare results of baseline and scenario to observe savings by increasing condensate recovery rate
- Capital Investment and financial requirements for increasing condensate recovery rate
Boiler operation and improving the efficiency is a good practice in Chemical and Process Engineering.
Why recovering of condensate is important in industries?
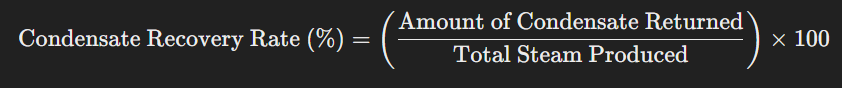
Recovering condensate is essential because it contains both sensible heat and valuable treated water, reducing the need for fresh makeup water and the energy required to heat it. The formula to calculate the condensate recovery rate is as below.
Benefits of High Condensate Recovery Rate
- Energy Savings: Condensate is hot, reducing the energy required to bring it back to boiling.
- Water Savings: Less fresh makeup water is needed, which reduces treatment costs.
- Chemical Savings: Minimizes boiler water treatment chemicals.
- Environmental Impact: Reduces water and energy consumption, thus lowering emissions.
Example calculations to improve condensate recovery rate
For efficient systems, a condensate recovery rate of 70–90% is typical. However, the achievable rate varies depending on factors like system design, steam trap efficiency, and the distance between steam users and the boiler.
How much water, fuel and energy provided by fuel can be saved by increasing the condensate recovery rate from 50% to 60%?
An industrial boiler is operated for a heating purpose and diesel is used as the fuel. Manufacturer has stated that boiler efficiency is 80%. Existing boiler operation conditions are as below.
A diesel-fired boiler operates at 80% efficiency according to the manufacturer specification.
- Steam requirement for process usage: 10 MT/h
- Pressure of steam header: 20 bar
- Temperature of steam: 2500C
- Deaerator vent rate: 0.2%
- Deaerator pressure: 0.25 bar
- Makeup water temperature of steam: 300C
- Blowdown rate: 1.0%
- Condensate recovery rate: 50%
- Site power input: 10kW
Based on the above details, we can readily sketch this process diagram by using US DOE MEASUR Tool. The diagram obtained from the tool is here.
Steps of sketching the baseline diagram for boiler operation using US DOE Measur Tool
US DOE Measure tool will help you to readily sketch the boiler operation diagram in a shorter period without doing manual calculations. Here, you are going to create the baseline diagram first and followed by the scenario model.
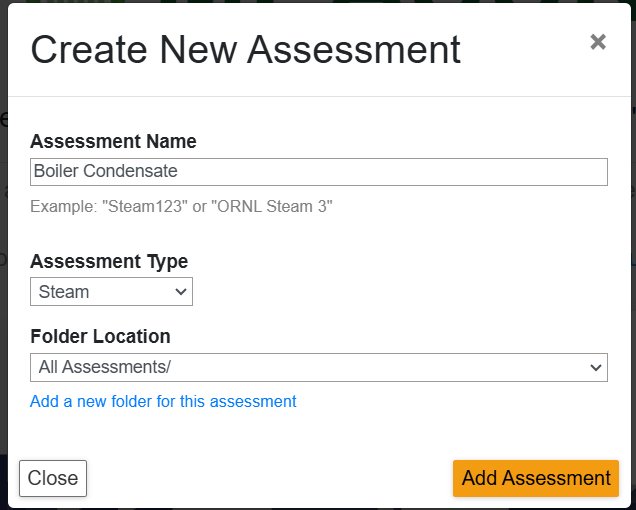
Create New Assessment
- Give Assessment name
- Select Assessment type as Steam
- Then click “Add Assessment“
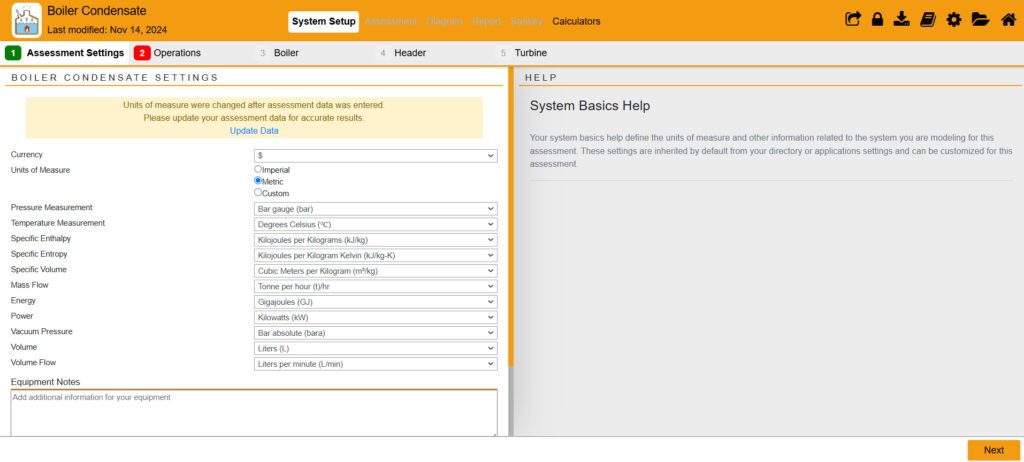
Complete Assessment Settings
- Change the Unit of Measurement to Metric.
- Keep other data as it is.
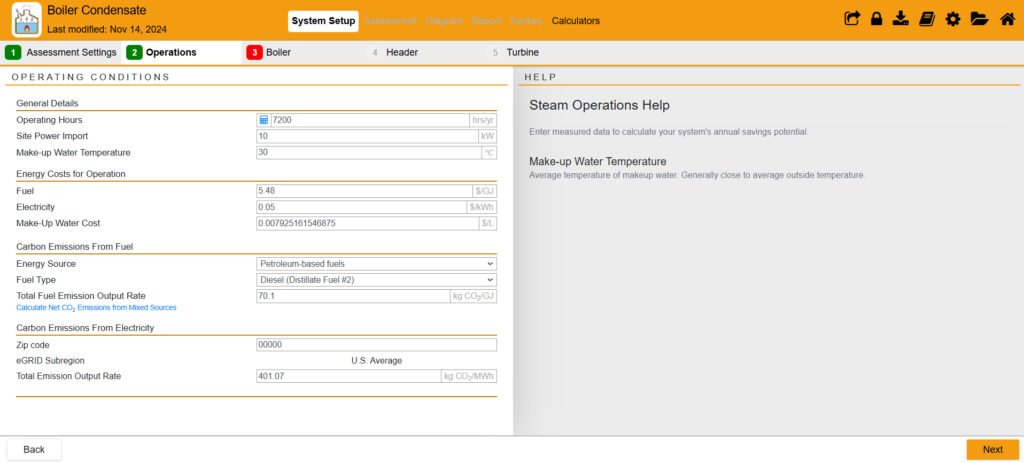
Complete Operations
- Operating hours: Boiler operates 24 hours per day and for only 300 days per year, total operating hours will be 7200 hours.
- Site power input is 10 kW.
- Change makeup water temperature as 300C.
- Keep other data as it is.
- Click Next.
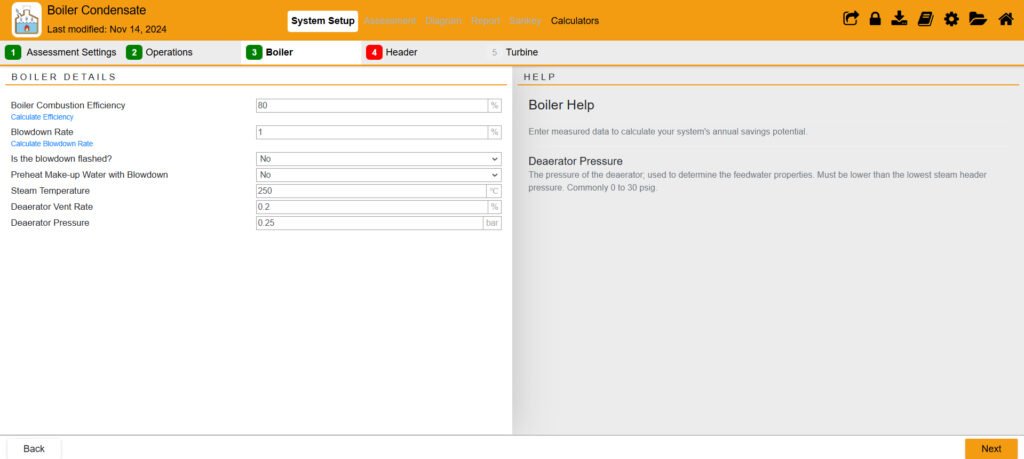
Complete Boiler Settings
Fill out this form with the given details.
- Boiler Combustion efficiency: 80%
- Blowdown rate: 1%
- Blowdown flashing: No
- Preheating makeup water with blowdown water: No
- Steam temeperature: 2500C
- Deaerator vent rate: 0.2%
- Deaerator pressure: 0.25 bar
- Click Next
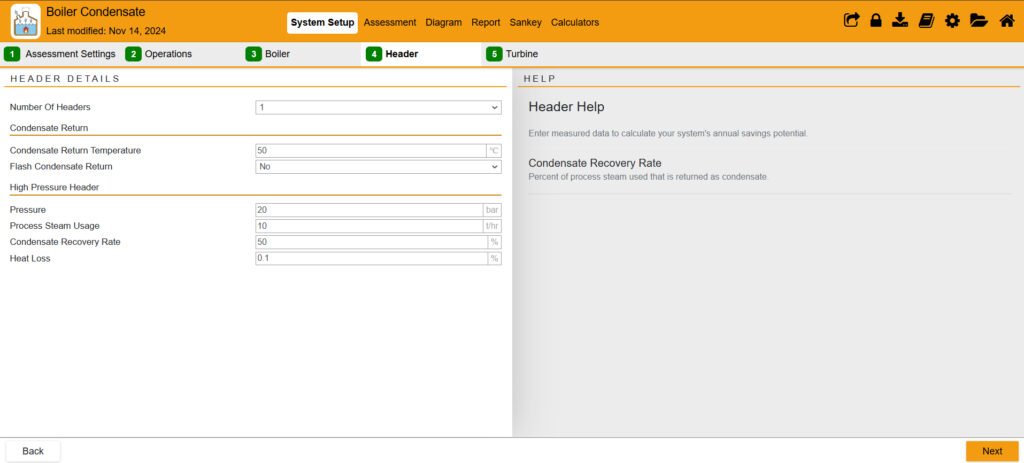
Complete Boiler Header Settings
Fill out this section with the given details.
- Number of headers: 1
- Condensate return temperature: 500C
- Flash condensate return: No
- Pressure of high-pressure header: 20 bar
- Process steam usage: 10 MT/hour
- Condensate recovery rate: 50%
- Heat loss: 0.1%
Complete Turbine Settings
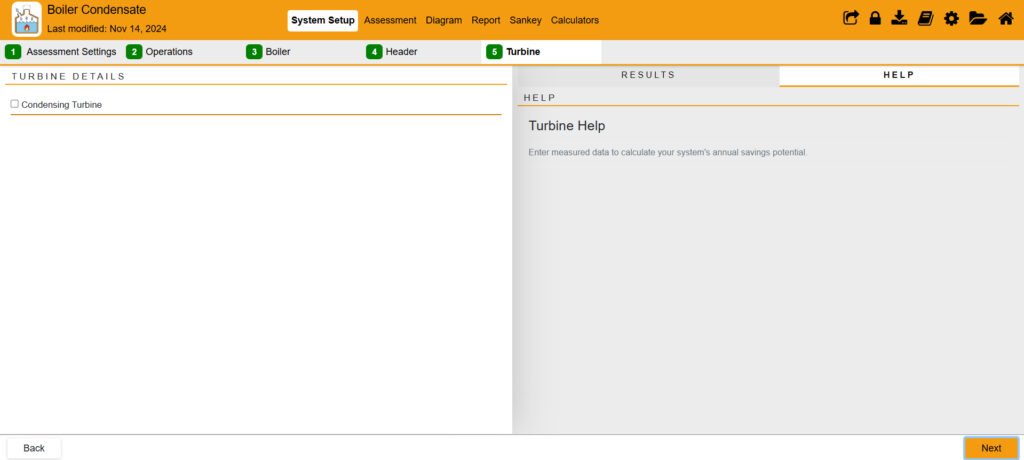
- There is no turbine connected to this boiler. Therefore, do not tick the “Condensing Turbine”.
- Click Next
Now, you have entered all the required data for the US DOE MEASUR Tool and can explore the sketch of boiler operation. Click the Diagram Tab to view the boiler and utilities diagram. This diagram includes following sub units of boiler operation.
- Boiler
- Process usage
- Makeup water flow
- Deaerator
Diagram of boiler and utilities by US DOE Measur Tool
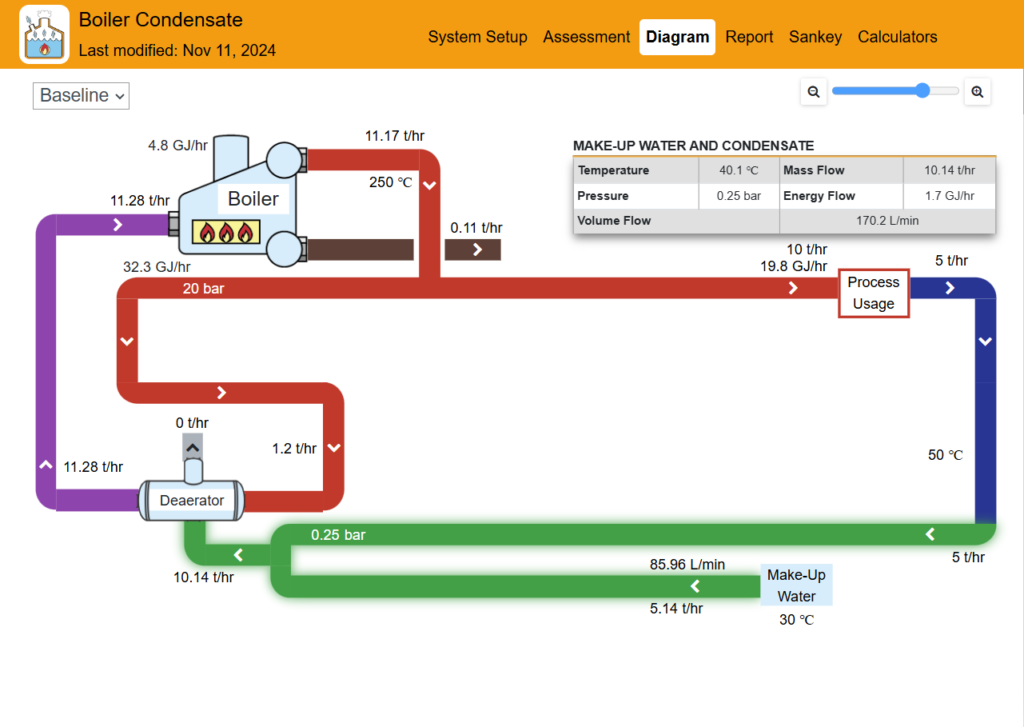
According to the above boiler and utilities diagram, only 5MT of condensate is returned to the boiler through the Deaerator. 5MT of steam and condensate is not returned. Therefore, there is a significant water quantity loss during the process usage. Also, there is a simultaneous energy loss.
Now we can try to determine how much makeup water can be saved by increasing the condensate recovery rate. Again we can use the same US DOE MEASURE tool to create a new scenario.
How much makeup water can be saved by increasing the condensate recovery rate?
We can check how the boiler operation diagram changes when we try a new scenario to compare the advantages of increasing the condensate recovery rate.
Steps to increase condensate recovery rate in a new scenario in Measur Tool
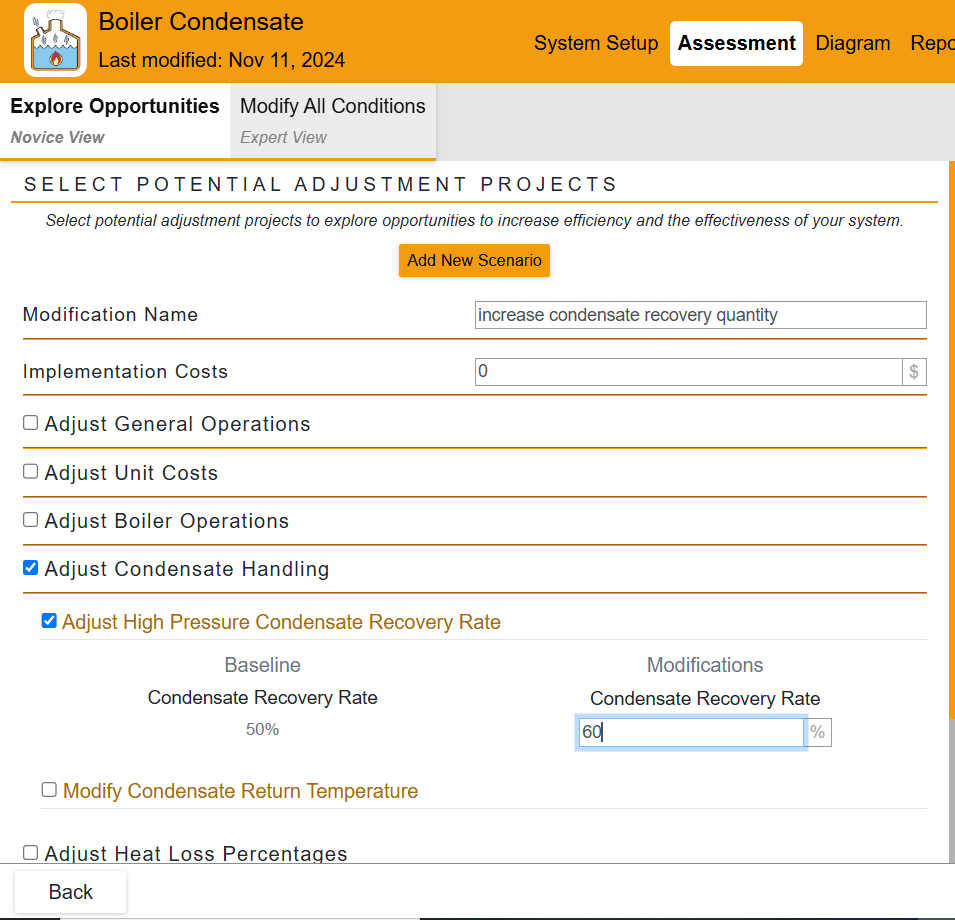
Add New Scenario
- Go to the Assessment tab.
- Add a new scenario and give a name (“increase condensate recovery quantity“) for the new scenario.
- Tick “Adjust Condensate Handling“
- Adjust High Pressure Condensate Recovery Rate
- Edit the “Condensate Recovery Rate” as 60% in the Modifications.
- Check the Diagram of new scenario and old model.
- You can observe makeup water quantity decreases and condensate recovey quantity increases.
Diagram of boiler operation after increasing Condensate Recovery Rate
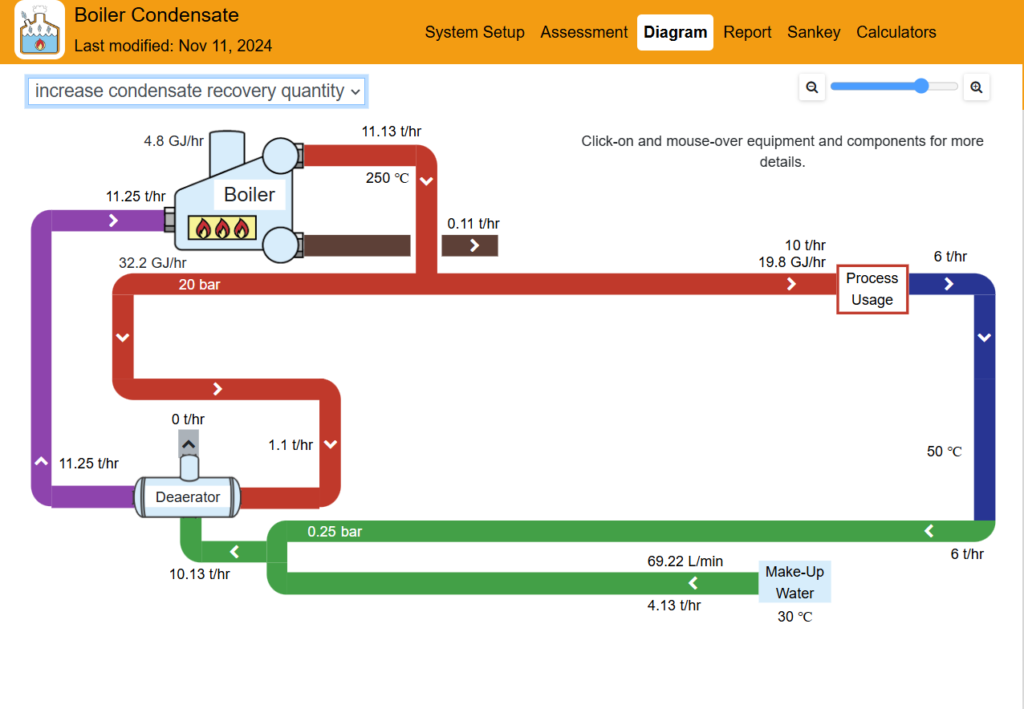
As a result, the makeup water flow rate decreased from 5.14 MT/h to 4.13 MT/h by comparing those two diagrams. As you can see, 1.01 MT/h of makeup water was saved as a result.
Annual makeup water saving quantity
Assuming the boiler operates 300 days per year and 24 hours per day.
| Annual Makeup water usage saving | = 1.01 MT/h * 24 h/day * 300 day/year | 7,272,000 L/year |
| Annual Makeup water usage saving | 7,272 MT/year |
Annual cost savings by makeup water saving
Assuming the water unit cost is $0.0079 per Liter. These unit prices may vary in your country or your region.
| Annual cost saving by Makeup water usage | = 7,272,000 L/year * 0.0079 $/L | 57,631.785 $/year |
Compare results of baseline and scenario to observe savings by increasing condensate recovery rate
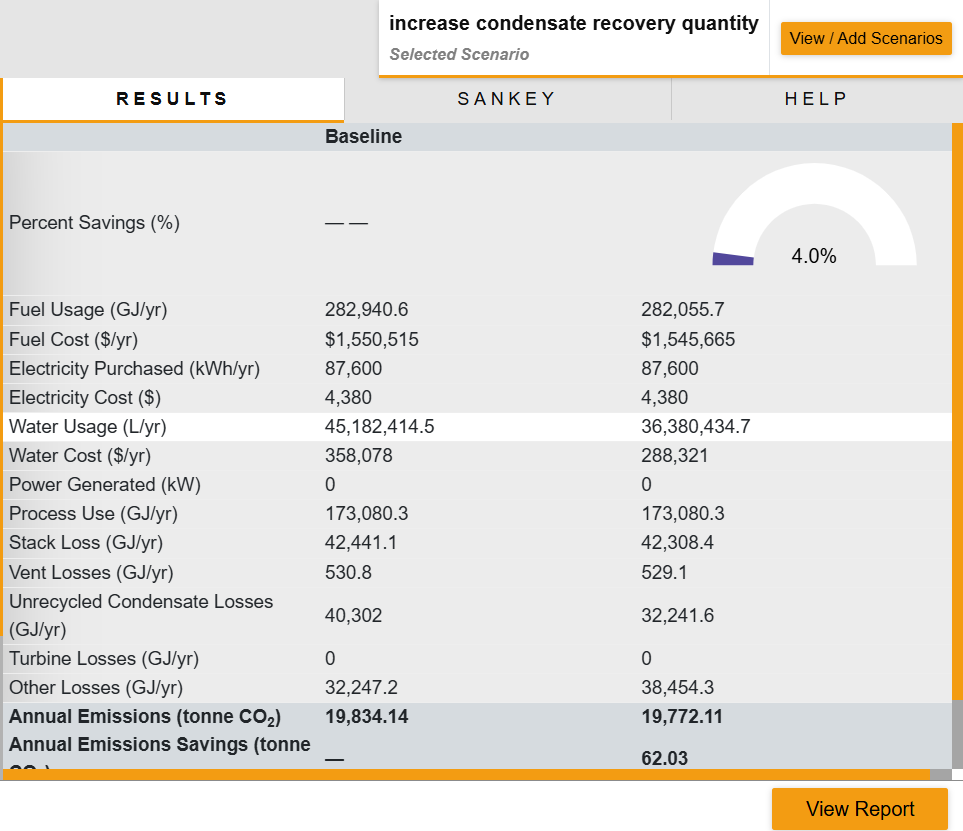
Fuel saving
Fuel consumption decreases because condensate now brings back more energy to the boiler. So, the required fuel flow rate is now less than previously required.
Reduction of stack loss energy
Due to less fuel usage, the quantity of flue gas also decreases. Therefore, stack loss energy also decreases which has a positive impact on the environment.
According to these studies, it show us there are significant economic savings and positives by increasing the condensate recovery rate. Therefore, industries always should target to maximize the condensate recovery rate by taking necessary technical actions.
Capital Investment and financial requirements for increasing condensate recovery rate
There is a requirement to invest money to build condensate storage tanks, pipelines, etc to capture and store more condensate. When engineers identify and suggest how to improve the condensate recovery rate, those kinds of capital investments should be studied.
Therefore, both technical experts and financial experts should work together to conduct a cost-benifit analysis to move forward.